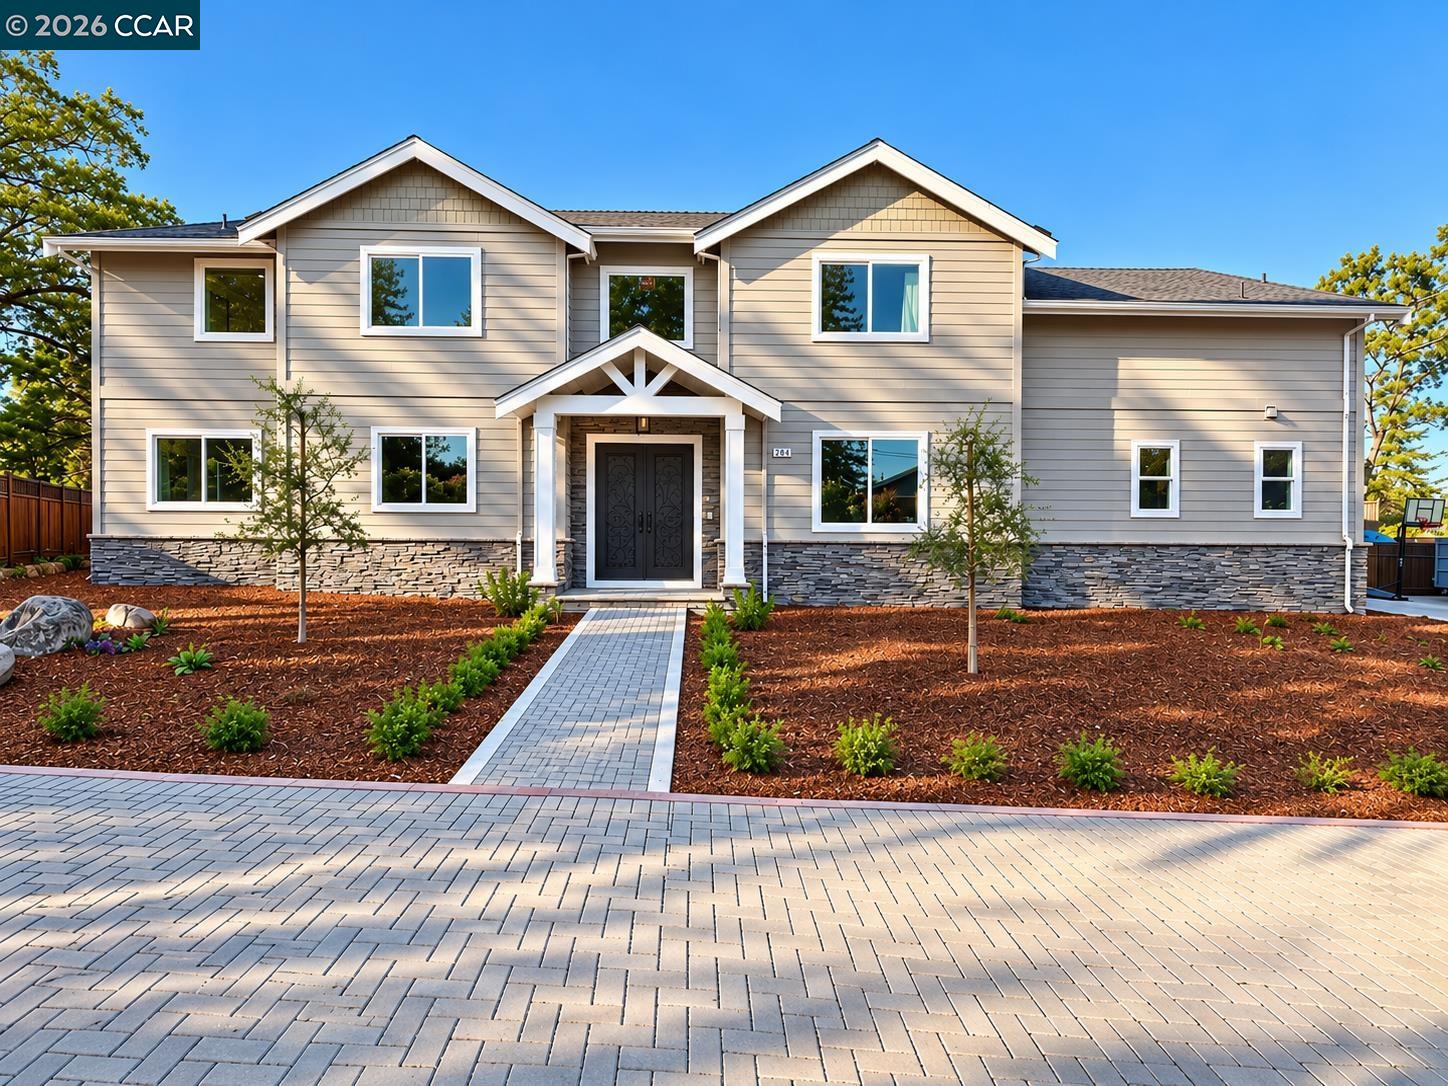
Nestled in the heart of Contra Costa County, Pleasant Hill perfectly lives up to its name, offering a vibrant, welcoming community with a quintessential suburban charm. Known for its highly rated schools, abundant green spaces, and a spectacular downtown, Pleasant Hill is a highly sought-after destination for families, young professionals, and anyone looking for the ideal balance of peaceful residential living and modern convenience.
34,592 people live in Pleasant Hill, where the median age is 42 and the average individual income is $65,935. Data provided by the U.S. Census Bureau.
Total Population
Median Age
Population Density Population Density This is the number of people per square mile in a neighborhood.
Average individual Income
There's plenty to do around Pleasant Hill, including shopping, dining, nightlife, parks, and more. Data provided by Walk Score and Yelp.
Explore popular things to do in the area, including Cakes and Berries, La Mordida, and Valero.
| Name | Category | Distance | Reviews |
Ratings by
Yelp
|
|---|---|---|---|---|
| Dining | 0 miles | 0 reviews | 0/5 stars | |
| Dining · $ | 0.47 miles | 350 reviews | 3.5/5 stars | |
| Dining | 0.52 miles | 0 reviews | 0/5 stars | |
| Dining · $ | 0.52 miles | 19 reviews | 2.3/5 stars | |
| Shopping | 0.46 miles | 4 reviews | 3/5 stars | |
| Shopping | 0.56 miles | 1 review | 3/5 stars | |
| Active | 0.45 miles | 0 reviews | 0/5 stars | |
| Active | 0.45 miles | 4 reviews | 5/5 stars | |
| Active | 0.46 miles | 9 reviews | 5/5 stars | |
| Active | 0.51 miles | 0 reviews | 0/5 stars | |
| Active | 0.55 miles | 0 reviews | 0/5 stars | |
| Active | 0.55 miles | 0 reviews | 0/5 stars | |
| Beauty | 0 miles | 0 reviews | 0/5 stars | |
| Beauty | 0 miles | 1 review | 5/5 stars | |
| Beauty | 0 miles | 0 reviews | 0/5 stars | |
| Beauty | 0.45 miles | 3 reviews | 5/5 stars | |
| Beauty | 0.45 miles | 0 reviews | 0/5 stars | |
| Beauty | 0.49 miles | 1 review | 5/5 stars | |
| Beauty | 0.52 miles | 0 reviews | 0/5 stars | |
| Beauty | 0.52 miles | 0 reviews | 0/5 stars | |
| Beauty | 0.52 miles | 1 review | 5/5 stars | |
| Beauty | 0.52 miles | 1 review | 5/5 stars | |
| Beauty | 0.54 miles | 2 reviews | 3/5 stars | |
| Beauty | 0.56 miles | 2 reviews | 3/5 stars | |
|
|
||||
|
|
||||
|
|
||||
|
|
||||
|
|
||||
|
|
Pleasant Hill has 13,452 households, with an average household size of 2.52. Data provided by the U.S. Census Bureau. Here’s what the people living in Pleasant Hill do for work — and how long it takes them to get there. Data provided by the U.S. Census Bureau. 34,592 people call Pleasant Hill home. The population density is 4,801 and the largest age group is Data provided by the U.S. Census Bureau.
Total Population
Population Density Population Density This is the number of people per square mile in a neighborhood.
Median Age
Men vs Women
Population by Age Group
0-9 Years
10-17 Years
18-24 Years
25-64 Years
65-74 Years
75+ Years
Education Level
Total Households
Average Household Size
Average individual Income
Households with Children
With Children:
Without Children:
Marital Status
Blue vs White Collar Workers
Blue Collar:
White Collar:
We strive to build connections and long-lasting relationships with our clients and this is the foundation of who we are in the community and as real estate agents.
CONTACT US